Screen Reader
|
Particulars |
Year Ended |
Year Ended |
|
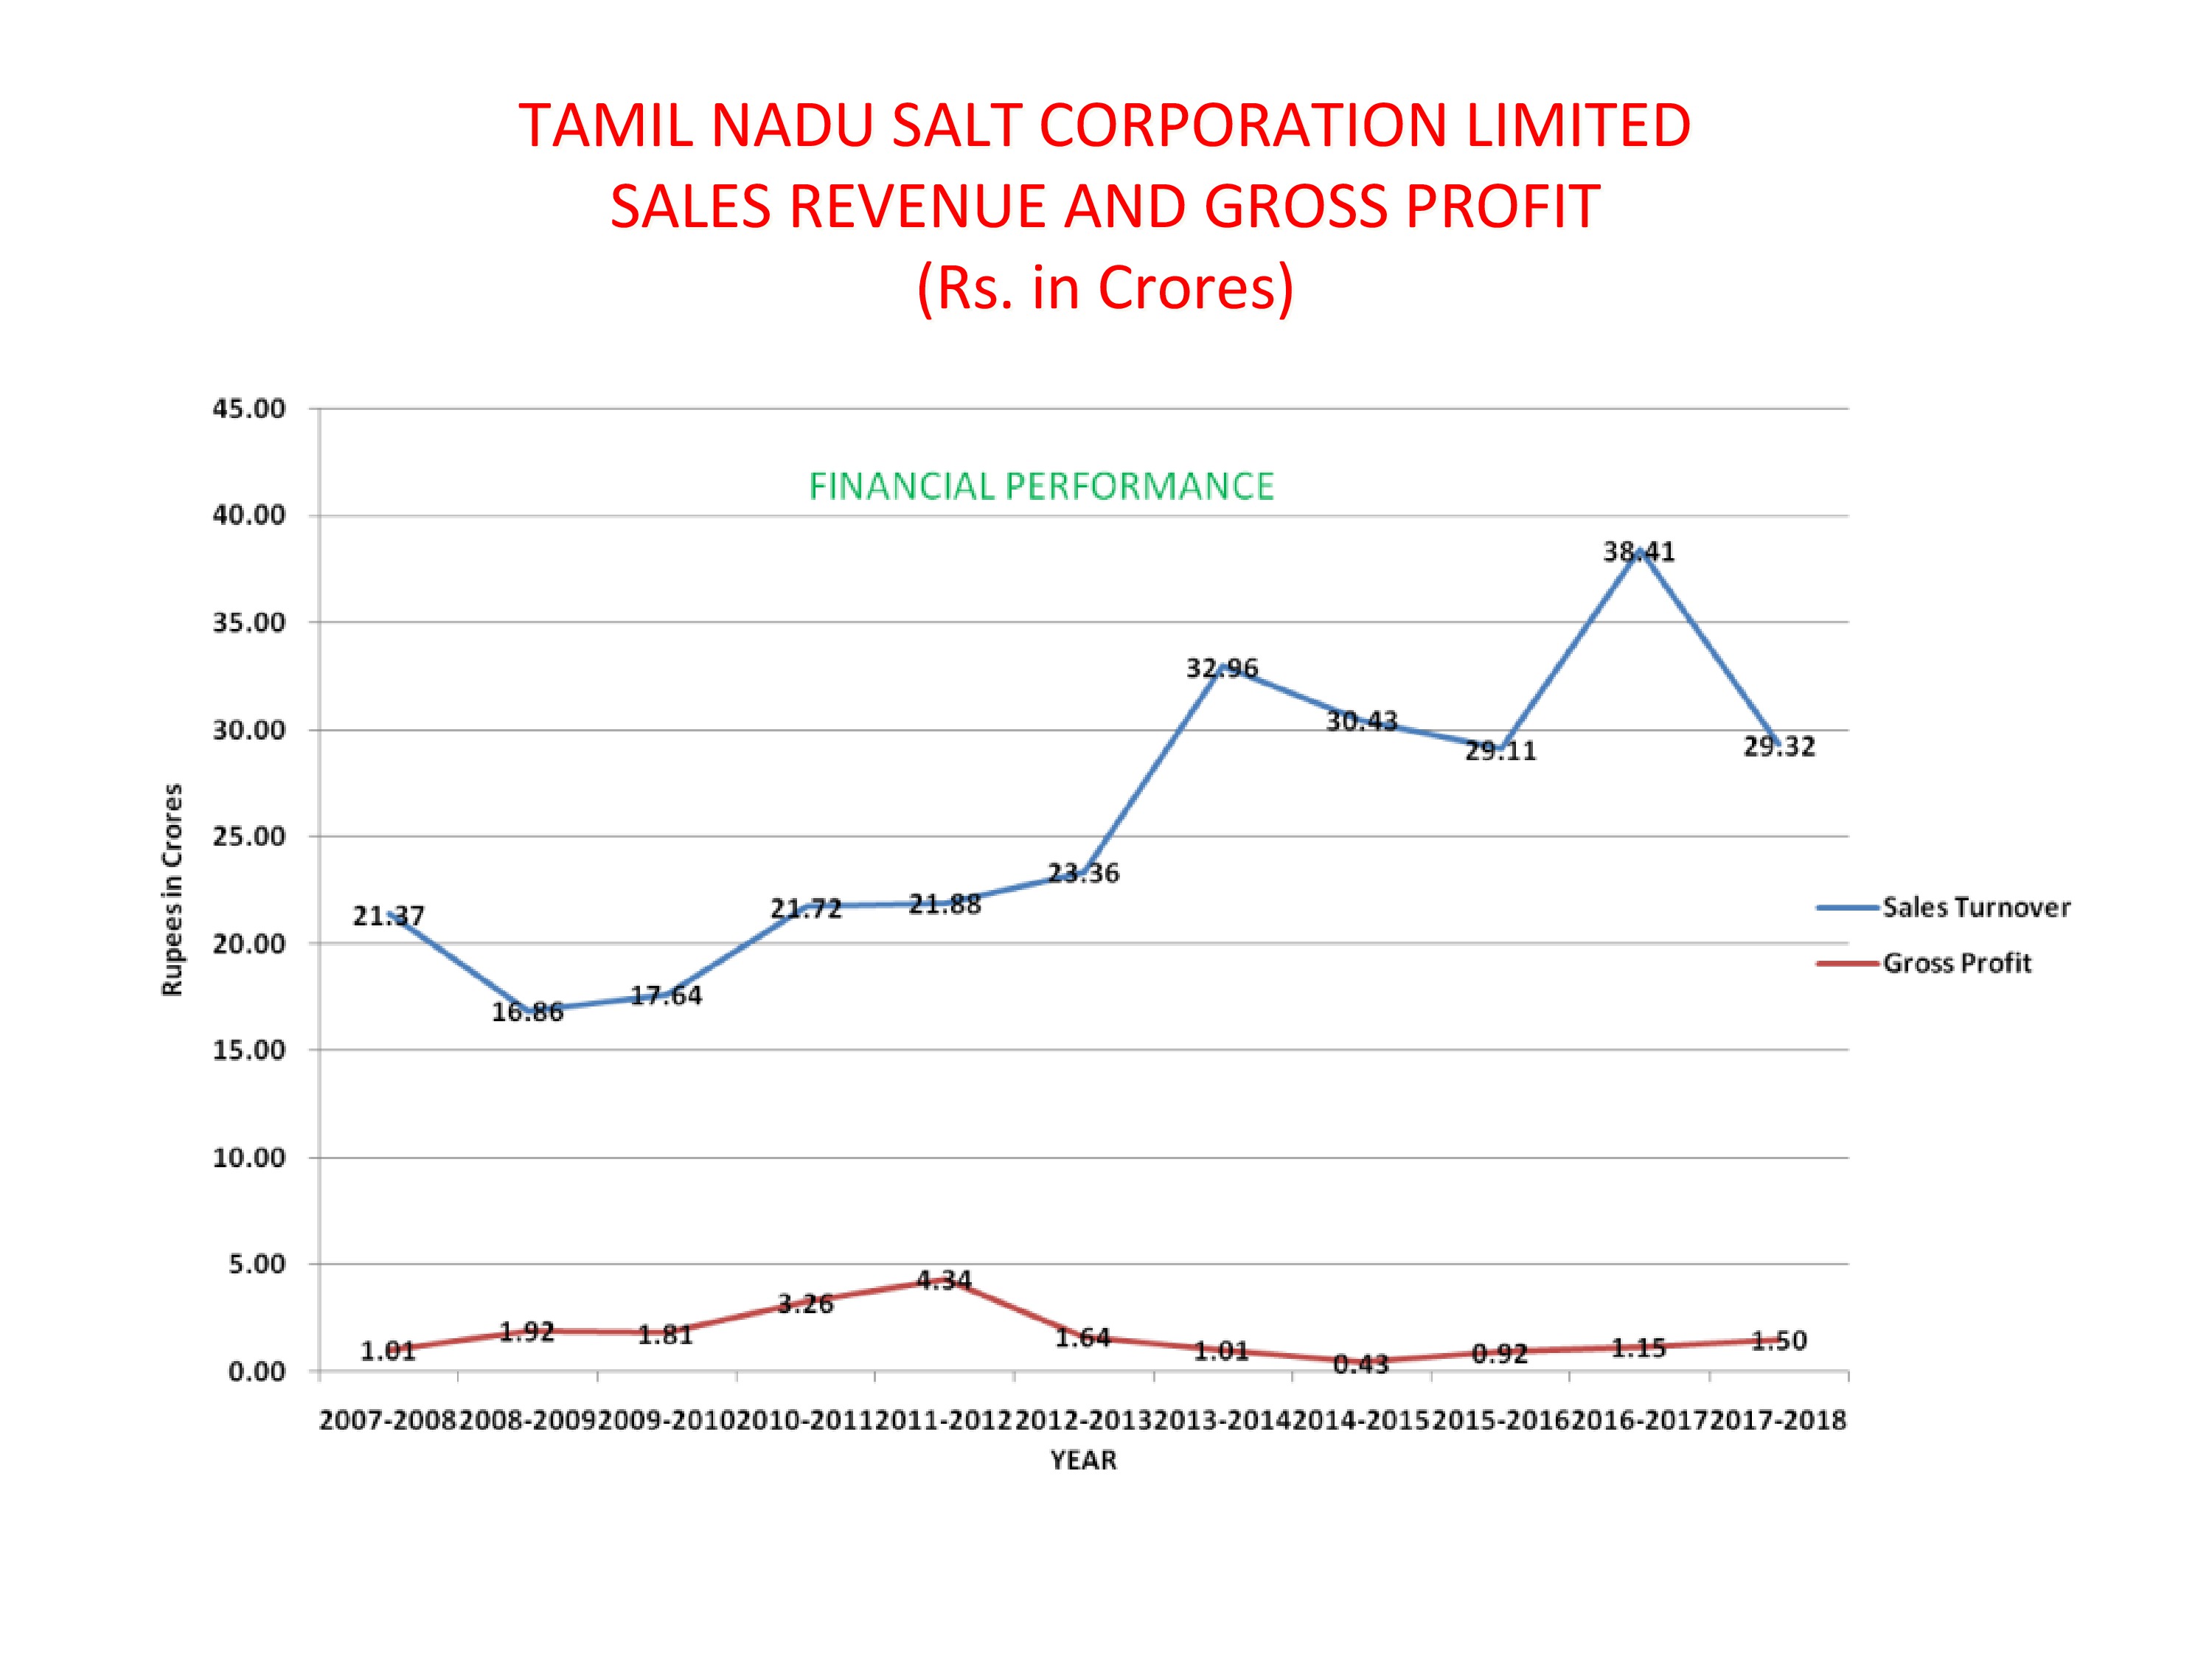
Revenue from Operations |
2054.89 |
2180.94 |
|
Earnings Before Interest, Tax and depreciation |
546.12 |
368.66 |
|
Financial Cost |
18.61 |
1.19 |
|
Depreciation and amortization expenses |
92.69 |
41.18 |
|
Profit Before tax |
434.69 |
326.29 |
|
Tax Expenses |
|
|
|
- A) Current Tax Expenses |
159.47 |
101.56 |
|
- B) (Less) MAT Credit |
-- |
-- |
|
- C) Current tax expenses relating to prior years |
-- |
-- |
|
- D) Net Current Tax expenses |
159.47 |
101.56 |
|
- E) Deferred Tax |
(9.57) |
(3.70) |
|
Tax Expenses |
149.89 |
97.85 |
|
Profit for the year Divided on Equity share (%) |
284.92
|
228.43
|
|
Issued, subscribed, and fully paid up equity share capital |
63,40,278 equity shares of Rs.10/-each amounting to Rs. 6,34,02,780/- |
63,40,278 equity shares of Rs. 10 each amounting to Rs. 6,34,02,780/- |